Natural history collections can last for hundreds of years but they need care and attention along the way. We recently installed a data logger to monitor the temperature, humidity, and light intensity in the herbarium. Humidity is an especially big threat to plant specimens.
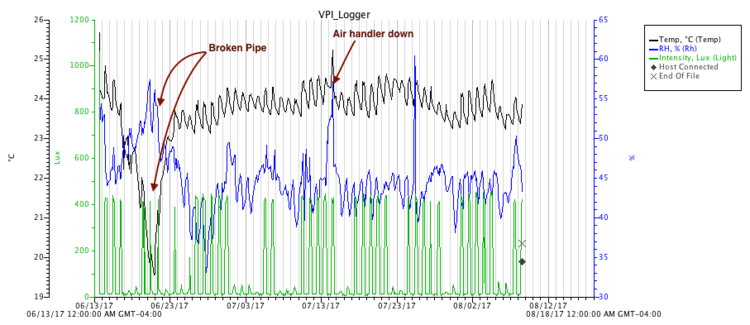
This graph shows the humidity (blue line), light intensity (green line), and temperature (black line) in the herbarium over the last couple months. You can start to pick up on patterns pretty quickly: the big spike in light intensity most days is from turning on the room lights. You can pick out weekends and collecting days by noticing where the light intensity doesn’t spike.
I labelled a couple of the spikes in maroon on the graph. Around June 20, you can see the humidity sharply increase and the temperature drop. This was caused by a broken water pipe leaking in the collection. (Fortunately no specimens were damaged!) And on July 14 you can see the humidity and temperature increase because of a broken air handler in the building.
Data like these let us ensure the herbarium is properly curated and pinpoint possible problems before they damage specimens.